
Timing Diagram
Timing diagrams in Astah Professional and Astah UML describe the behavior of classifiers and their interactions, focusing on the timing of events that cause changes in modeled conditions of Lifelines. They emphasize changes within and among Lifelines over time.

How to Create Timing Diagrams
- Navigate to the [Diagram] option in the Main Menu and select [Timing Diagram] to initiate a new Timing Diagram.

- Upon creation, a new Lifeline appears in the Diagram Editor, ready for modeling.

Frame
The Timing Diagram is enclosed in a frame where its name is displayed. This name can be edited by double-clicking within the frame or through the property view or the structure tree.

Lifeline
A Lifeline represents an individual participant in the diagram. In Astah, a single Lifeline is already on the diagram after you create a new Timing Diagram.

Adding Lifelines
There are several ways to add Lifelines on Timing Diagram.
1. From Tool palette
- Select [Lifeline] from the tool palette.
- Click on desired location to add a new Lifeline.

2. From Context Menu
- Right-click an existing Lifeline.
- Choose [Insert Lifeline Above/Below] from the context menu.

3. Drag and Drop
- Drag and drop a Class or Component onto the Timing Diagram.
- A new Lifeline will be created with the dropped model as its BaseClass.

4. Keyboard Shortcuts
- Select a Lifeline.
- Press [Enter] to add a new Lifeline below, or [Shift] + [Enter] for above.
Adjusting Lifeline Length
The length of Lifelines in a Timing Diagram can be adjusted by dragging the edge of the diagram frame. Note that you cannot change an individual lifeline’s length independently.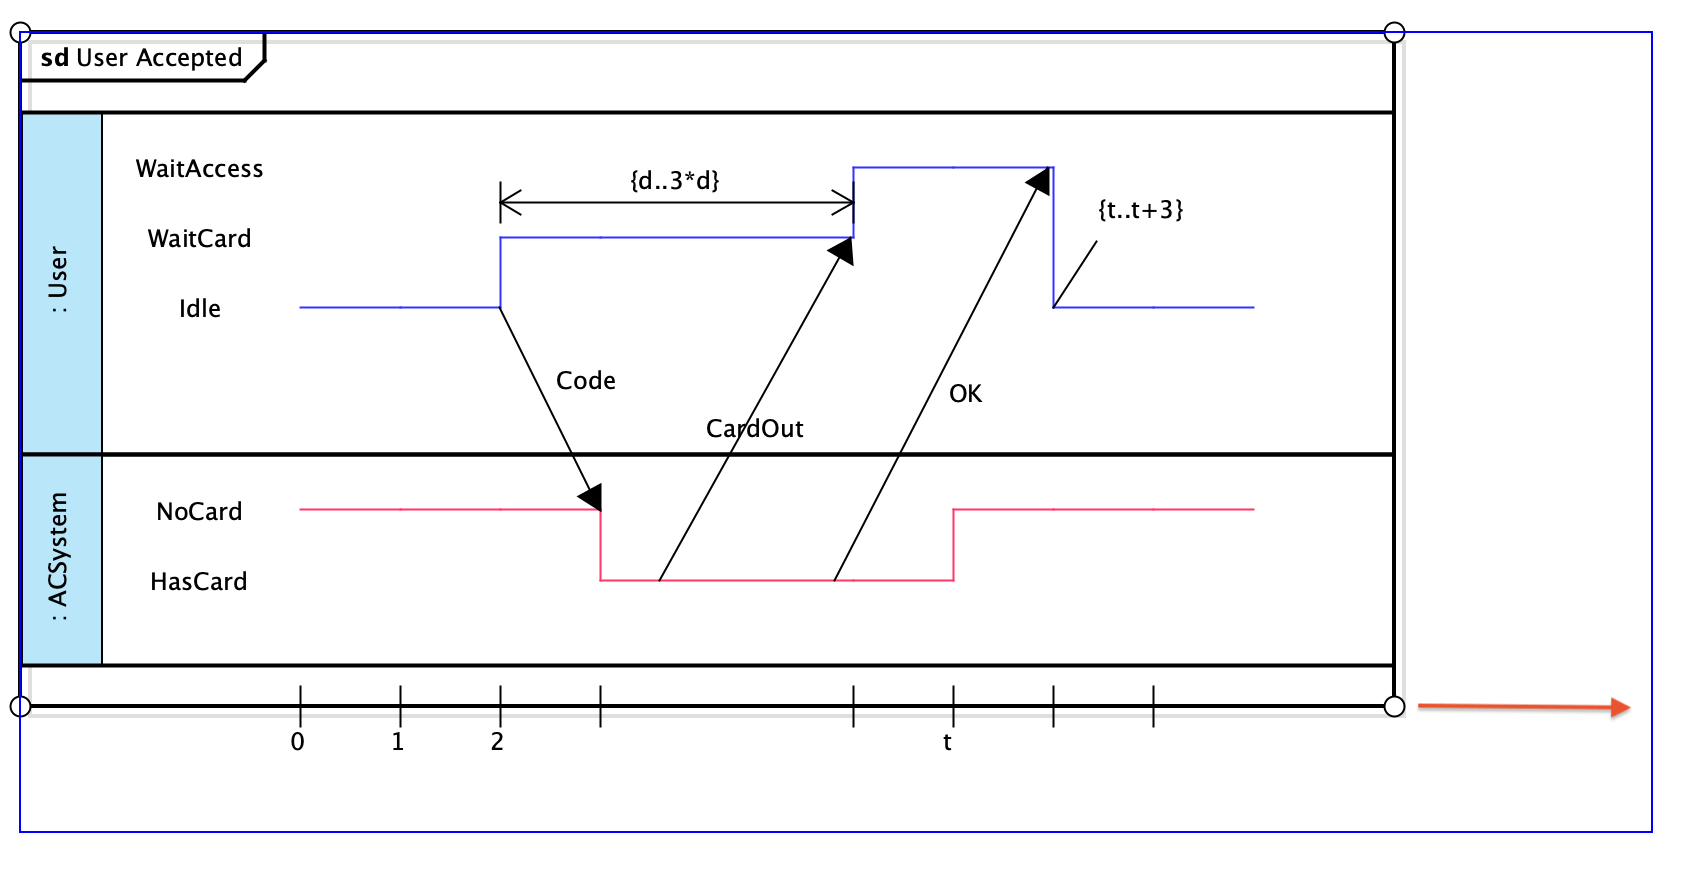
To shorten the lifeline length to fit the content, right-click on the diagram frame and select Minimize Size → This Diagram.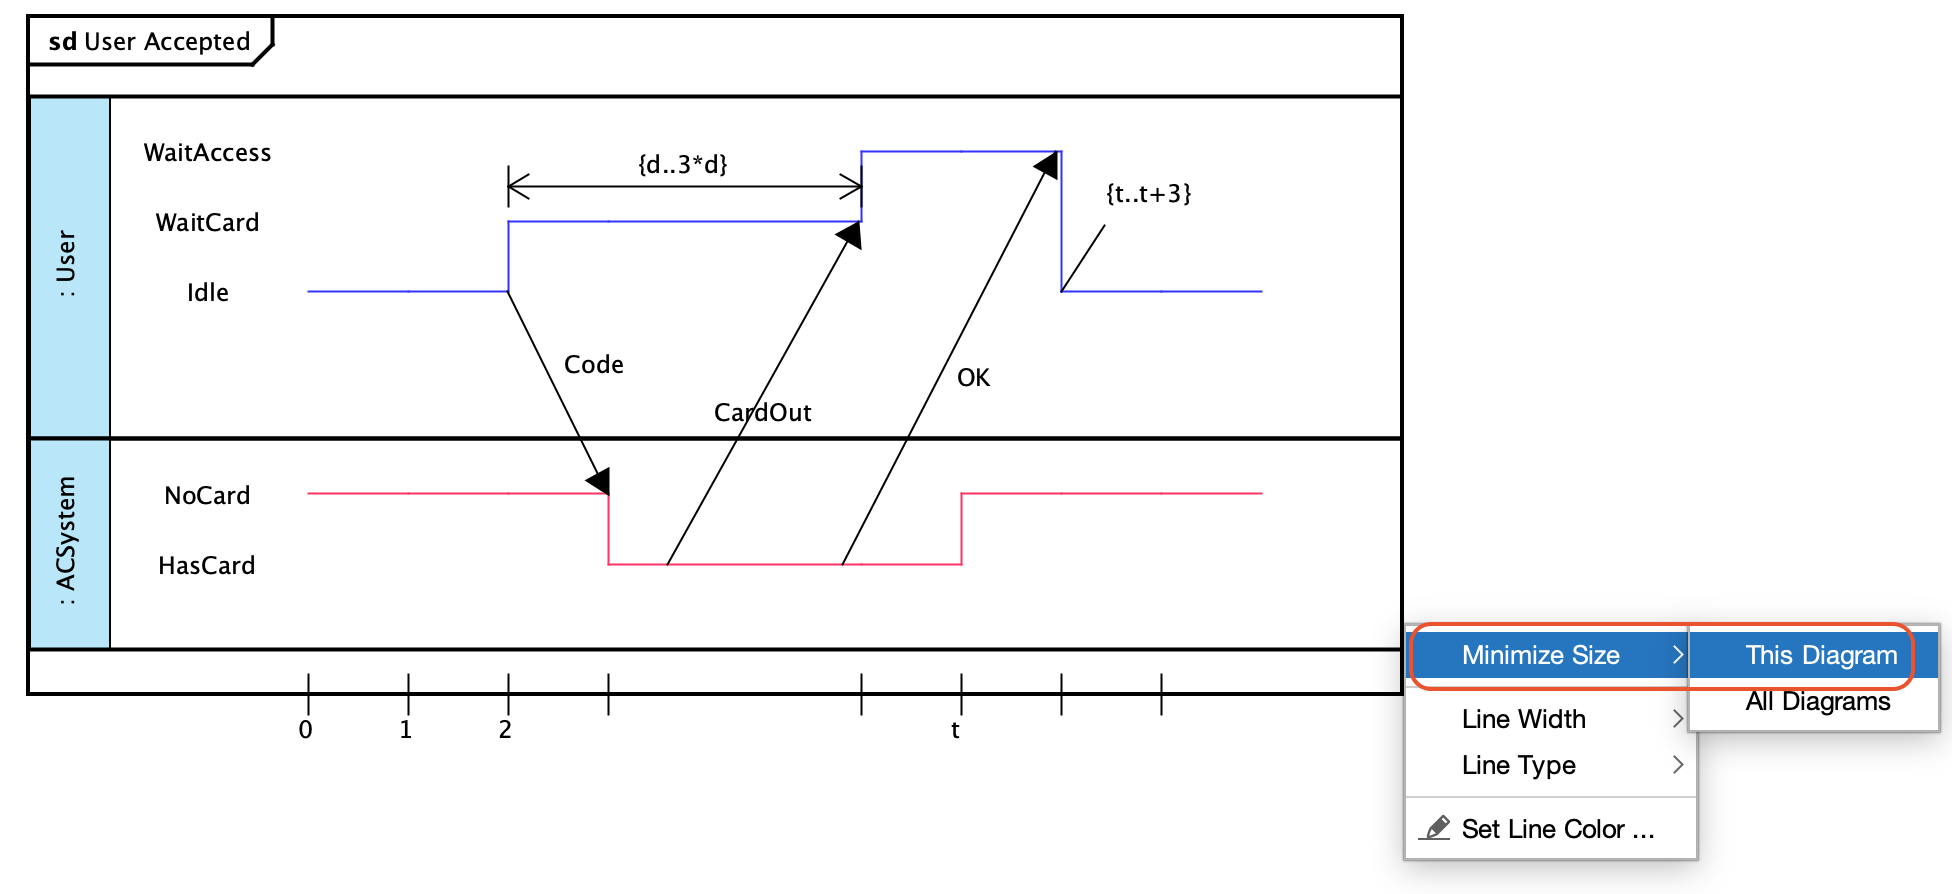
State / Condition
Every Lifeline includes a default State/Condition.
You can rename this State/Condition by directly double-clicking it or the property view (Left-bottom pane).
Adding States and Conditions
There are two ways to add States/Conditions.
1. From Context menu
- Right-click a State/Condition.
- Select [Insert State/Condition Above/Below] from the context menu.

2. Keyboard Shortcuts
- Select a State/Condition.
- Press [Enter] to add a new State/Condition below, or [Shift] + [Enter] for above.

Timeline
A Timeline is automatically attached to a State/Condition.
Moving the Timeline
Timeline can be moved by directly dragging to another State/Condition.
- Select the timeline that you want to move on the diagram.

- Simply drag it to another State/Condition.

- Now the duration of the timeline is moved to the target State/Condition.

Enable the Representation of Continuous State
Starting from version 10.0, you can now toggle the timeline presentation to display continuous state.
To enable this, right-click on the timeline and select [Continuous State] from the context menu.
Alternatively, you can activate this feature through the [Continuous State] option in the property view, located in the bottom-left pane.

Message
Messages between Lifelines (including asynchronous and reply messages) are created by selecting a message type from the tool palette and designating start and end points.
- Select a Message type you want to create from the tool palette.
- Click on a start point then an end point.

- A message will be created.

Duration Constraint
You can represent a DurationConstraint from the step below.
- Select [Duration Constraint] on the tool palette then click a start point.

- Click on the end point and ensure that the red arrow is indicating the duration you want.

- Complete the label.

- Now the Duration Constraint is shown on the diagram.

Time Constraint
You can represent a TimeConstraint from the step below.
- Select a [Time Constraint] on the tool palette then click a start point.

- Click a start point then end point.

- Complete the label and it’s done.

Tick Mark Values and Timing Ruler
You can adjust tick mark values, intervals, and their visibility to suit your needs. This is done either through the diagram’s property view or by directly interacting with the tick mark via right-click.

Setting the Default Values
For consistent modeling, set default values for tick intervals and other options by navigating to [Tools] → [System Properties] → [UML]. Adjust your preferences and apply them with [OK].

View Mode
Astah supports two primary view modes for Timing Diagrams: Full and Compact.
Each serves different visualization needs, from detailed analysis to simplified overview.
Full View:
The standard, detailed visualization showing all elements. This mode is default and ideal for in-depth examination of diagrams.

Compact View:
Offers a simplified overview by briefly showing States/Conditions in each Lifeline. This view is beneficial for presentations or when a high-level diagram summary is needed.

In Compact View, your ability to edit is restricted. While you can rename Lifelines and States/Conditions, the tool palette is disabled, limiting further modifications. This ensures the diagram remains clutter-free and focused on essential information.
Switching View Mode:
There are two ways to do switch the view mode:
- Via Structure Tree:
Right-click on the Timing Diagram in the Structure Tree and select [View Mode] → [Full/Compact].
- Via Diagram context menu:
Right-click on the Timing Diagram and select [Show Compact View] or [Show Full View].
